Study Summary Window
- Introduction
- Using Study Summary
- Menus
- Settings
- Settings >> Graphics Settings
- Settings >> Set Title
- Settings >> Selection Highlights All Columns
- Settings >> Sort Locked
- Settings >> Include Hidden Studies
- Settings >> Include Hidden Subgraphs
- Settings >> Display Study Names
- Settings >> Text Draw Styles Display Text
- Settings >> Text Draw Styles Display When True
- Settings >> Display Values for Last Visible Bar
- Settings >> Display Daily Quote Data Fields
- Settings >> Set Quote Fields
- Settings >> Attach/Detach Window
- Settings >> Always on Top
- Settings >> Always Visible Across Chartbooks
- Settings >> Include All Chartbooks
- Alerts
- Settings
- Sorting Data by Selecting Column Header
- Navigating to Charts from Study Summary
- Setting Alerts and Alert Highlighting
- Chart Management Related to Study Summary
- Study Management Related to Study Summary
- Number, Text, and Color Control for Study Summary Subgraph Cells
- Study Summary Rows Including Multiple Charts
- Why a Chart is Required for the Studies in the Study Summary Window
Introduction
The Study Summary window provides a table view of the Study Subgraphs of studies in the charts in an open Chartbook, set to be included in the Study Summary. Refer to the example image below.
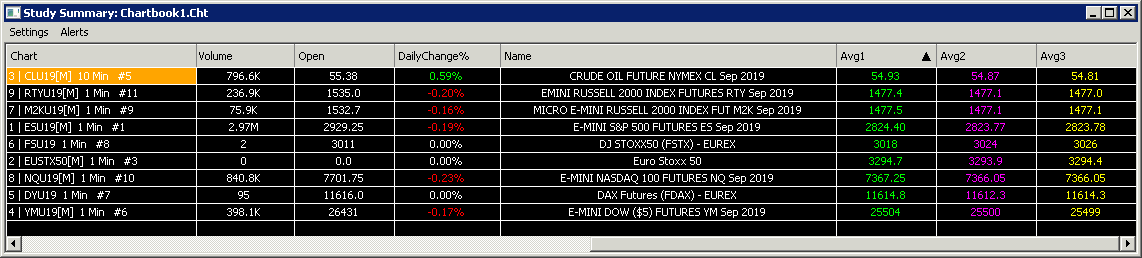
There is only one Study Summary window per Chartbook and it is saved with the Chartbook. A Study Summary window can be set to display data from all Chartbooks by enabling Settings >> Include All Chartbooks on the Study Summary window menu.
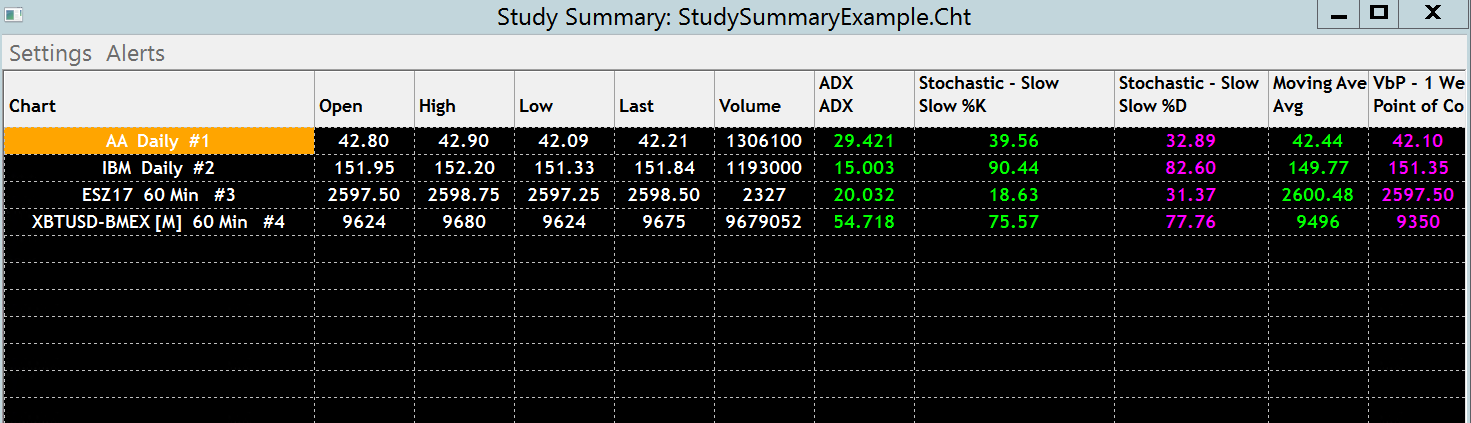
Charts and Studies that have Alert Condition Formulas defined for them and the result evaluates to TRUE, are highlighted in the Study Summary using the Study Summary: Alert True Background color configured through the Graphics Settings.
The Study Summary consists of a table where the rows represent each chart in the Chartbook that either has a TRUE Alert Condition Formula result or has a study which is set to be included in the Study Summary.
If none of the columns are set to be sorted, then the order of the charts among the rows is dependent upon the internal order of charts within the Chartbook.
The columns represent the Study Subgraphs set to be included in the Study Summary on those charts.
Each Study Subgraph can be set to be included in the Study Summary or not. Among all of the rows/charts that are displayed, only the same named study can be included once for those charts. So for example, if the ADX study is set to be included in one or more charts, it will only be displayed once in the table. Any additional instances of this study within the same chart will be skipped.
When determining whether a study is skipped or not, it is identified by its name and whether it is set to be included in the Study Summary. You can change the study name through the Short Name setting on a study to include more than one instance of the same study in the Study Summary.
The order of the studies on the Study Summary depends upon the display priority of a particular named study. The display priority first is determined by the number of times it occurs among all of the charts that are set to be included in the Study Summary. And second by the order the study exists in the Studies To Graph list relative to other studies.
When determining the number of times it occurs among all of the charts that are set to include it in the Study Summary, only the first instance of the study per chart is counted.
Using Study Summary
Follow the instructions below to use the Study Summary window.
- Open the charts that you want to include in the Study Summary window.
- Add the studies that you want to include in a Study Summary window to those charts.
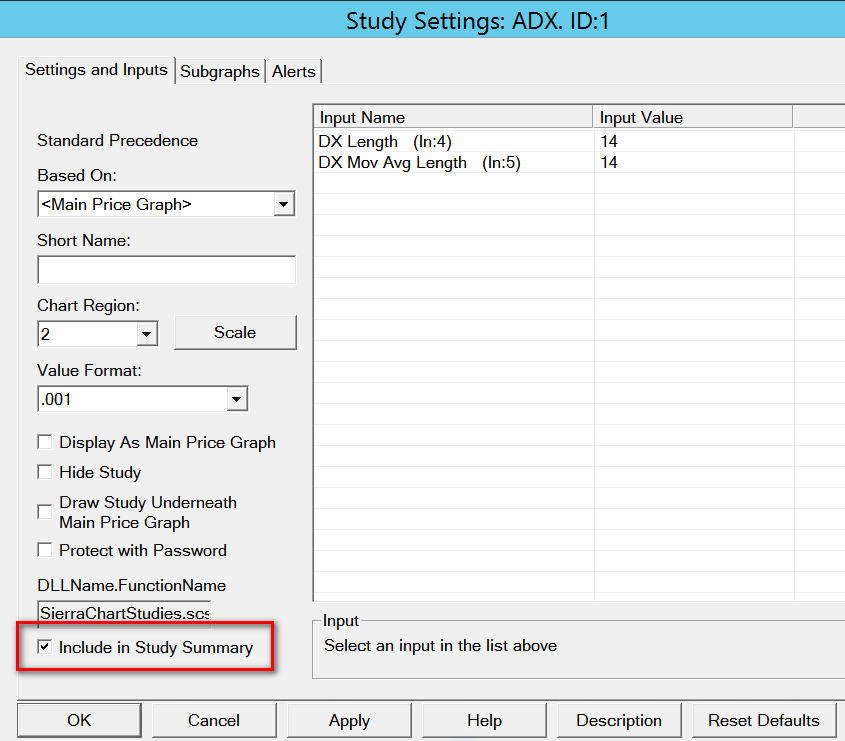
- Open the Study Settings window for a study to be included in the Study Summary window.
- Select the Settings and Inputs tab and enable the Include in Study Summary option. For new studies this is enabled by default. Refer to the image below.
- Optionally set a Short Name on the study.
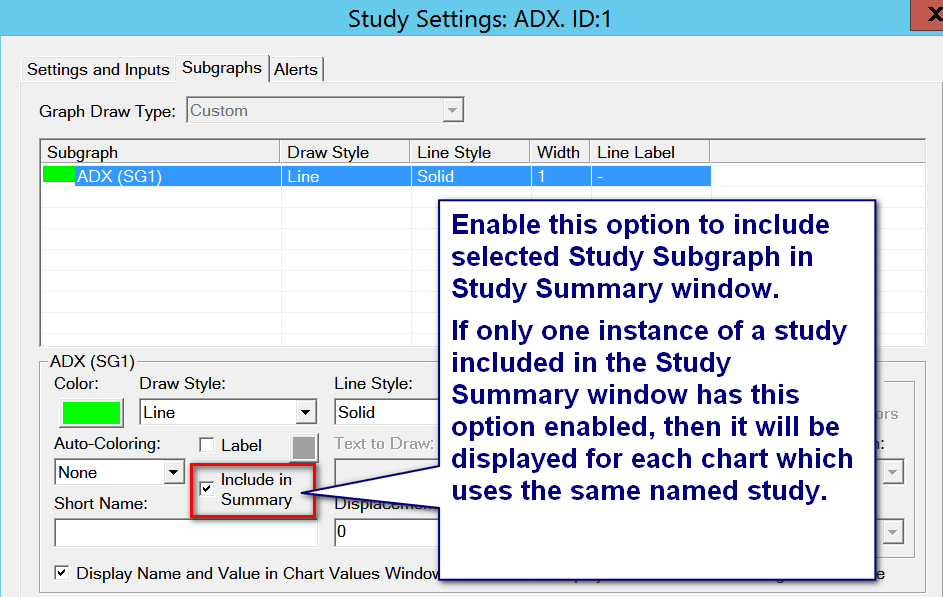
- Select the Subgraphs tab. Select a particular Subgraph you want included in the Study Summary in the list of Subgraphs.
- Enable the Include in Study Summary option. For new studies this is enabled by default. Refer to the image below.
- Press OK.
- Repeat steps 3 through 7 for each study to be included in the Study Summary window.
- Adjust the order of the studies in the Studies to Graph list according to the order in which you want them displayed on the Study Summary window.
- Press OK.
- Open the Study Summary window through File >> Open Study Summary Window.
- Adjust the size of this window as required.
- Adjust the column widths as you require. The column widths can be adjusted by left clicking and dragging at the border between columns on the header at the top. The location where you need to left click, you will notice a short red vertical line display signifying that an adjustment can take place by left clicking and dragging.
Menus
The following sections gives an overview of the items available through the pulldown menus on the Study Summary Window.
Settings
The following item are available through the Settings pulldown menu on the Study Summary Window.
Settings >> Graphics Settings
Selecting this option brings up the Global Graphics Settings Window. For more information refer to Graphics Settings.
Settings >> Set Title
Selecting this option brings up the Enter Custom Title window into which text can be entered. Select OK on the Enter Custom Title window to have the entered text displayed in the Title Bar instead of the standard Study Summary text.
Settings >> Selection Highlights All Columns
This option toggles whether the entire row of data is highlighted using the Study Summary: Background color.
Settings >> Sort Locked
This option toggles whether selecting a column Title sorts the information in the Study Summary by the information in that column. Having this option checked (selected) disables the ability to sort.
Settings >> Include Hidden Studies
This option toggles whether studies that have the option Hide Study selected are displayed in the Study Summary or not. Having this option checked (selected) will display information for hidden studies.
Note that selecting this option will only display the column for the hidden studies if there is subgraph data to display. If the subgraphs in the hidden studies are also hidden, and the option Include Hidden Subgraphs is not enabled, then a column for the hidden study will not be displayed.
Settings >> Include Hidden Subgraphs
This option toggles whether data for subgraphs that have their Draw Style set to either Hidden or Ignore is displayed. Having this option checked (selected) will display information for hidden subgraphs.
Note that selecting this option will only display the column for the hidden subgraph if there is a study to display. If the Study for the hidden subgraph is also hidden, and the option Include Hidden Studies is not enabled, then a column for the hidden subgraph will not be displayed.
Settings >> Display Study Names
This option toggles whether the study name is displayed in the column header. Having this option checked (selected) will display the study name.
Settings >> Text Draw Styles Display Text
This option toggles whether Subgraphs that display information as text will display as text, or if the Subgraph data will be displayed as a number formatted according to the Value Format defined for the study of which the Subgraph is a member.
Having this option checked (selected) will display the data as text.
Settings >> Text Draw Styles Display When True
When this option is enabled, then a study that displays a text value will only be displayed when its Simple Alert state is currently true.
Settings >> Display Values for Last Visible Bar
Normally the Study Summary window displays the study values and other chart values at the very last column/bar in the chart.
When this option is enabled, then the Study Summary window will display study values and other chart values based upon the last visible bar.
This lets you scroll the chart and allows you to see the values in the study summary window based upon the current scroll position of the chart.
In this particular case you may want to enable the Scroll Position Chart Linking option for the charts used with the Study Summary window so that they all scroll together and there is consistency with the information displayed in the Study Summary window.
Settings >> Display Daily Quote Data Fields
This option toggles whether daily Quote Data fields are displayed in the Study Summary or not. Having this option checked (selected) will display the Quote Data fields.
The specific fields that are displayed when this option is checked is controlled by selecting Settings >> Set Quote Fields on the Study Summary window.
Settings >> Set Quote Fields
Selecting this option opens the Customize Quote Board Fields window. This window allows for changes to the columns of data that are displayed for each symbol when the Display Daily Quote Data Fields option is selected.
The Customize Quote Board Fields window is shared with the Quote Board, including the saving and loading of defaults.
For information on the available fields, refer to Field Descriptions.
Settings >> Attach/Detach Window
Selecting this option will Attach or Detach the Study Summary Window to the main Sierra Chart application.
When this window is Attached, then it is managed by Sierra Chart and is part of the windows within the application. Therefore, the Study Summary Window will always be displayed when changing between Charts and Chartbooks that are also attached to the main Sierra Chart application.
When this window is Detached, then it is managed by the Operating System. Therefore, the Study Summary Window will have its own icon in the taskbar and will move behind or in front of other windows as selected. This also means that the Study Summary Window will not always be visible when moving between Charts and Chartbooks within the main Sierra Chart application.
Settings >> Always on Top
This option toggles whether the Study Summary Window will always be on top of all other windows, and therefore always in view. Having this option checked (selected) will force the window to always be on top of all other windows.
This option is only available when the Study Summary Window is Detached.
Settings >> Always Visible Across Chartbooks
This option toggles whether the Study Summary Window is visible in all Chartbooks, or only the Chartbook for which it displays the study information. Having this option checked (selected) will make the Study Summary Window display in all Chartbooks.
This option is only valid when the Study Summary Window is Attached. Otherwise, this option has no impact on the Study Summary Window.
Settings >> Include All Chartbooks
This option toggles whether the Study Summary Window includes data from all Chartbooks, or only data from the Chartbook in which it was originally opened. Having this option checked (selected) will make the Study Summary Window display data from all Chartbooks.
Alerts
The following item are available through the Alerts pulldown menu on the Study Summary Window.
Alerts >> Show Alert Manager
Selecting this option brings up the Alert Manager window. For more information, refer to Alerts Manager.
Alerts >> Add Symbol Alert
Selecting this option brings up the Add Symbol Alert window. For more information, refer to Symbol Alerts.
Alerts >> Mute All Alert Sounds
This option toggles whether all Alert sounds are muted or not. Having this option checked (selected) will mute all Alert sounds.
This option toggles the setting in the main pulldown menus for Global Settings >> Mute All Alert Sounds. For more information refer to Mute All Alert Sounds (Global Settings).
Alerts >> Alert Number for New High/Low
This option brings up the Set Alert Number for New Highs/Lows window. Setting a number in this window between 1 and 100 will utilize that Alert Number if there is a new High or Low value for the symbol referenced by the study displayed in the chart.
For more information, refer to New High and Low Highlighting Alert.
Sorting Data by Selecting Column Header
It is possible to sort the data within the Study Summary window based on a particular column's information. In order to sort the data, the Settings >> Sort Locked option on the Study Summary menu needs to be not be enabled. If this option is enabled, then selecting a column header will only select the column, and will not sort the data.
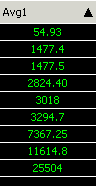
To sort the data, left-click the desired column header that contains the data to be the basis for the sort. It may be necessary to click twice, as the first click will be interpreted as the selection of the column, if the column was not already the selected column. When sorted a small up or down arrow will appear on the right side of the column header.
The first sort option is denoted as an arrow pointing up, and sets the column sorting in Ascending order. When sorted in this order, the entire row of data is moved up or down such that the value in the selected column that has the smallest value is listed in the first row with the rest of the rows getting larger as you move down the rows to the last row of data in the column.
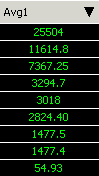
Selecting the same column again will set the second sort option denoted as an arrow pointing down, and sets the column sorting in Descending order. When sorted in this order, the entire row of data is moved up or down such that the value in the selected column that has the largest value is listed in the first row with the rest of the rows getting smaller as you move down the rows to the last row in the column.
It is possible to sort by a specific column and then lock the sorting (Settings >> Sort Locked), which will not allow for further sorting changes to be made. Any additional data that is added to the Study Summary will be sorted based on the sorting that already selected.
Navigating to Charts from Study Summary
It is supported through the Study Summary window to navigate to the associated chart for a row displayed on the Study Summary window for that particular chart.
This is accomplished simply by performing a double-click operation with your Pointer anywhere along that row for the chart. The chart will be activated.
If the Chartbook the chart is contained in is currently not the visible Chartbook, it will be made the visible Chartbook first. It may not be visible Chartbook if the Study Summary window has enabled Settings >> Always Visible Across Chartbooks.
Setting Alerts and Alert Highlighting
A chart which has an Alert Condition Formula set on it which is TRUE, will have the Chart field for it highlighted in the Study Summary. To set the Alert Condition Formula on the chart, refer to To Enter an Alert Condition on the Main Chart/Price Graph.
A study on a chart set to be included in the Study Summary that has an Alert Condition Formula set on it which is TRUE will have its Subgraphs fields highlighted in the Study Summary. To set the Alert Condition Formula on a study, refer to To Enter an Alert Condition on a Study.
To set the highlight color, select Global Settings >> Graphics Settings - Global. Set the Study Summary: Alert True Background color to what you require. For complete documentation, refer to Graphics Settings.
Chart Management Related to Study Summary
This section documents various methods for managing multiple charts to be included in the Study Summary window in an organized, consistent, and efficient way.
If you have a large number of charts you want to include in the Study Summary window and do not normally need to look at those charts, then the charts can be put in a separate Chartbook.
The Study Summary window for that Chartbook and be made always visible by enabling Settings >> Always Visible Across Chartbooks on the Study Summary Window menu. Or as an alternative, on the Study Summary window menu, enable Settings >> Include All Chartbooks.
Charts can also be hidden through Window >> Hide Window. Charts Windows can also be destroyed when hidden by enabling Destroy Chart Windows When Hidden.
You can reduce the Use Days to Load >> Days to Load within a chart, if the data is not necessary for the study values at the last bar in the chart. This will make the chart load faster and also conserve memory.
When setting up a large number of charts, you can use the Chart >> Duplicate Chart command to duplicate a new chart from an existing chart with identical settings.
Use the Chart Linking feature for charts to maintain consistent settings among a group of charts. There are different categories of settings that can be linked.
The order in which the charts are displayed in the Study Summary window, when there is not a table column set for sorting, is according to the internal order of charts as they exist in the Chartbook. To make sure there is no column set for sorting on the Study Summary window, left click on the Name header at the top left until it shows no Up or Down arrow.
To set a custom name for chart that is visible on the Study Summary window in the first column (Chart), set this through the Title Bar Name in the Chart >> Chart Settings.
Study Management Related to Study Summary
If you want to have a set of charts with a consistent set of studies on each of those charts to be able to use in the Study Summary window, then use the Chart Linking feature and link the Studies among all of those charts.
In this way, when a study or studies is changed on one chart, all other charts with the same Link Number will all update and all be identical to each other in regards to the study configuration.
Number, Text, and Color Control for Study Summary Subgraph Cells
For each Study Subgraph at each row in the study Summary, by default what is displayed is the value for the last chart bar for the Study Subgraph. The format is controlled by the Value Format of the study.
When Settings >> Text Draw Styles Display Text is enabled on the Study Summary menu and the Subgraph Draw Style is Text, Transparent Text, Text with Background, then the Text to Draw to set for the Subgraph is displayed instead of the Subgraph value.
An ACSIL study which sets sc.Subgraph[].StudySummaryCellText to a text string for particular study Subgraph will then have that text displayed for the study Subgraph instead of the Subgraph value.
The Font size for the text displayed in the Study Summary is controlled through the Study Summary item on the Fonts and Text tab of the Graphics Settings window.
The following describes the foreground coloring rule for Study Subgraphs values displayed in the Study Summary:
- The foreground/text color for values or text for study Subgraphs in the Study Summary is the Study Subgraph Color itself.
The background coloring of cells for Study Subgraphs displayed in the Study Summary Window is done per cell. The following describes the background coloring rules for Study Subgraphs displayed in the Study Summary:
- If an ACSIL study has set sc.Subgraph[].UseStudySummaryCellBackgroundColor to true, then the background color is set with sc.Subgraph[].StudySummaryCellBackgroundColor.
- If the study is a Spreadsheet System/Alert type of study and for a particular Study Subgraph the alert state is true, then the background color is the Study Summary Alert True Background color.
- If the study is not a Spreadsheet/System Alert type of study and the alert status is true for the study, then the background color is the Study Summary Alert True Background color.
- There are special coloring rules for the Study Summary for a cell for the Color Background Based on Alert Condition study. When the alert state is true for the study which means that it is true for the last bar in the chart, then the following color rules apply:
The foreground color is the standard Study Summary row background color. The background color is the Color Background Based on Alert Condition study Subgraph primary color.
When the alert state is false, then the background color is the standard Study Summary row background color and the foreground color is the Color Background Based on Alert Condition study Subgraph primary color. - If the study is on a selected row and Settings >> Selection Highlights All Columns, then the background color will be the Study Summary Selected Row color.
- Otherwise, the background color will be the Study Summary Row Background color.
The foreground coloring for the Chart, Symbol, Last Time, Last, Daily Change, Bid, Ask, Bid Size, Ask Size, High, Low, Volume, Daily Change %, Name fields within the Study Summary window use the Chart Text color setting. To set this, refer to Graphics Settings.
Study Summary Rows Including Multiple Charts
To include study data from multiple charts in a single row on the Study Summary will require that you overlay studies from multiple charts into a single chart which is then included in the Study Summary.
To do this, use the Study/Price Overlay study.
To be sure each instance of the Study/Price Overlay study uniquely shows up on the Study Summary requires that each instance use a different Short Name.
Why a Chart is Required for the Studies in the Study Summary Window
The concept of study values on the Quote Board without an associated chart has no reasonable method to the implementation.
Some questions about this are:
- Historical data is required but Quote Boards do not have historical data. Therefore, at least one chart object which loads historical data, is required in the background for each symbol.
- How can studies be calculated without a chart object? They cannot be. A chart is required.
- What are the Study Settings for the study values? It is necessary to set Study Settings and this requires a chart object which supports Chart Studies and Study Settings windows.
- What are the Chart Settings for the chart? How much historical data is needed? This requires a chart and also requires the Chart Settings window.
- Is there any missing data in the historical data the calculations are performed on? This requires a chart to visualize this.
- In the case of a futures contract near rollover, what about the historical futures data for the prior contract? Does this data even exist? What is the rollover date? Is it back adjusted? This requires a chart to configure the settings and to ensure there is no missing data.
- If a Sierra Chart user says there is something wrong with a study value on a Quote Board, first how would they obviously know this to begin with just by looking at it in isolation without seeing it on the chart and seeing the underlying price bars? The answer is they cannot. The next question is what is the historical data it is based on? Is it complete and does it have any data errors? If the data requires back adjustment, is the back adjustment enabled, and is it working properly and is all of the necessary data for that present. All of this is exceptionally difficult to even answer to the literal point of insanity without being able to see the chart.
A chart object with Chart Settings and Study Settings windows is absolutely is required for studies on the Study Summary window.
The basic elements of a chart object are as follows:
- The loading on a thread of the chart data from the data stored in the chart data files.
- The building of the chart bars according to settings which there are numerous ones.
- The storage of the resulting bars.
- The display of the resulting bars which is not relevant in this case and can be disabled on a chart by hiding the chart and by enabling the option to destroy a chart window when hidden.
- The calculation of technical studies on that data.
- The ability to access the resulting calculations.
- A Chart Settings interface.
- A Study Settings interface.
These are the basic components of a Sierra Chart chart object and that type of object is absolutely needed to produce a study for a timeframe per bar that a chart is not already opened for.
Keywords: Study Summary, Study Board, Radar Screen.
*Last modified Wednesday, 15th November, 2023.